Latitude vs. Max Temperature
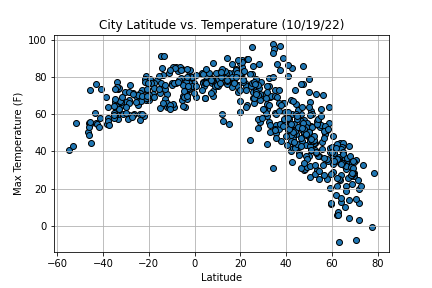
This graph shows that cities around the equator (where latitude = 0) generally have a higher temperature. For cities in the northern hemisphere, there is a very strong negative correlation (r-value = -0.82). The opposite is true for cities in the southern hemisphere: a strong positive correlation (r-value = 0.70). Therefore, it can be concluded that as cities approach a latitude further from 0 in either direction, temperatures generally decrease.
Visualizations


